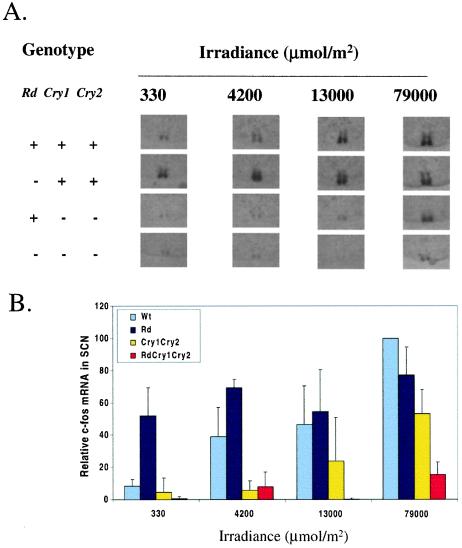
Figure 4.
Roles of cryptochromes and classic opsins in the photoinduction of c-fos in SCN. (A) Representative slices exhibiting the strongest signal at each light dose in the SCN are shown for each of the four genotypes. (B) Dose–response plot of c-fos induction in the SCN of wild-type and mutant mice. Levels of c-fos are expressed relative to the wild type at the highest dose used (79,000 μmol/m2), which is taken as 100%. The bars indicate standard deviations. The number of animals used for the three lower doses was n = 3, and for the highest dose n = 7–9. Statistical analyses by using a one-tailed paired t test showed that induction in the triple mutant was significantly different (P < 0.05) from wild type at all doses tested.

