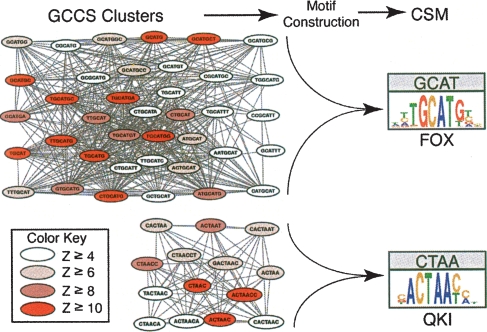
Figure 5.
Samples of GCCS clusters derived from the donor intronic (DI) region. Shown are the graph clusters representing the clustered n-mers used to construct the CSMs for the putative Fox and QKI protein binding sites (Fig. 7, DI-1 and DI-2, respectively). Vertices are colored according to their conservation Z-score (see color key). The graphs were drawn using GraphViz (http://www.graphviz.org/).

