
Table 1.
Summary of the numbers of significantly enriched n-mers found in the DI and AI and of the GCCS clustering performance
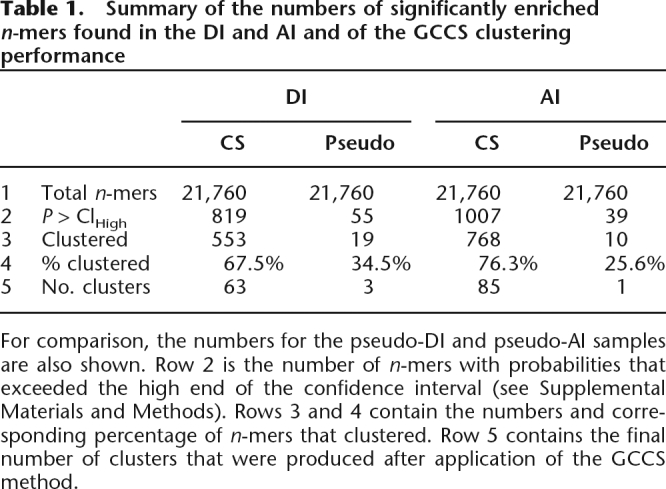
For comparison, the numbers for the pseudo-DI and pseudo-AI samples are also shown. Row 2 is the number of n-mers with probabilities that exceeded the high end of the confidence interval (see Supplemental Materials and Methods). Rows 3 and 4 contain the numbers and corresponding percentage of n-mers that clustered. Row 5 contains the final number of clusters that were produced after application of the GCCS method.