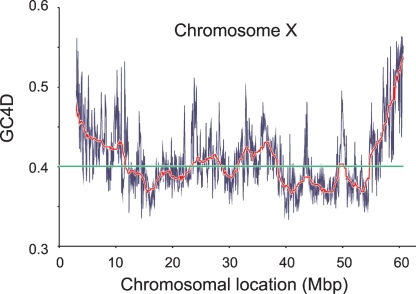
Figure 4.
G+C content along the Monodelphis X chromosome. This plot shows the increase in G+C content at the telomeric end of the long arm of the Monodelphis X chromosome. The thin blue lines show the G+C content for adjacent 50-kbp windows along MDOX, while the thick red line is a running average of 50 such windows. The average G+C content for the entire chromosome is shown by the horizontal green line.

