
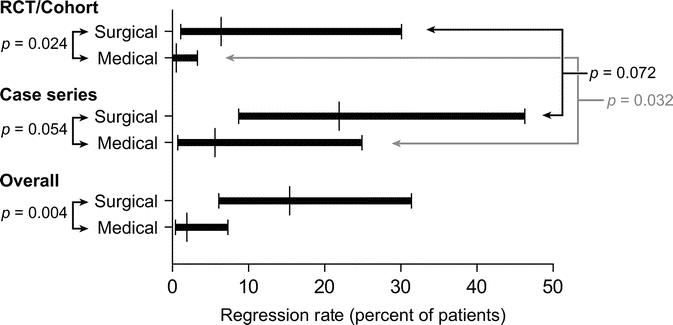
FIGURE 6. Comparison of probability of regression to lower grades of dysplasia, nondysplastic, or nonmetaplastic tissue, between surgically and medically treated patients. This comparison was repeated using only controlled studies and again using only case series. To test for heterogeneity, probability of regression was also compared between case series and controlled studies within each treatment group.