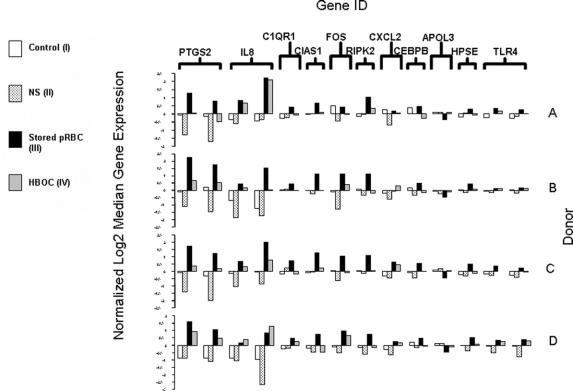
FIGURE 3. Normalized log-transformed median-centered gene expressions for significant inflammatory related genes are graphed for each donor (A–D). The y-axis depicts log2 gene expression signal values ranging from −3.0 to 3.0 magnitudes and the x-axis shows the 4 different treatment groups bracketed by each inflammatory gene (designated abbreviations listed in the Fig 2. table). Intradonor comparisons show that the PRBC group (III) collectively induced greater proinflammatory gene expression levels than the other 3 groups.

An official website of the United States government
Here's how you know
Official websites use .gov
A
.gov website belongs to an official
government organization in the United States.
Secure .gov websites use HTTPS
A lock (
) or https:// means you've safely
connected to the .gov website. Share sensitive
information only on official, secure websites.
