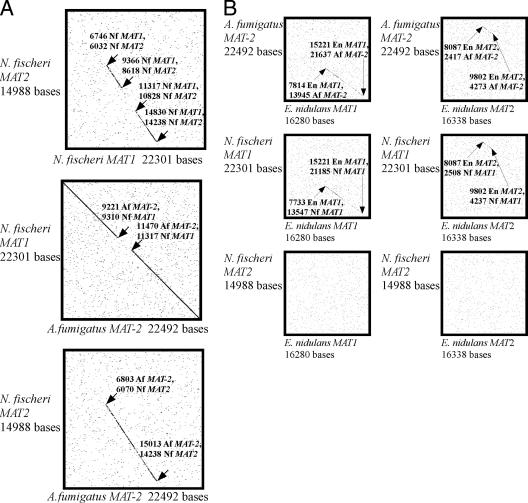
FIG. 2.
Dot plot comparisons of pairwise alignments of DNA sequence data for N. fischeri (Nf), A. fumigatus (Af), and E. nidulans (En). Sequence lengths are given along the axes near the sequence identifications. (A) Three dot plot alignments compare MAT loci and flanking regions, including coding regions and ∼5,000 bp upstream and downstream, obtained from the preliminary assembly of sequence contigs from the TIGR N. fischeri genome project for strain NRRL181. In the top dot plot, the MAT1 and MAT2 regions from N. fischeri are compared. In the middle dot plot, the MAT locus region of A. fumigatus (MAT-2 in the genome project strain Af293) is compared to the MAT1 region of N. fischeri. In the bottom dot plot, the MAT locus region of A. fumigatus (MAT-2 in the genome project strain Af293) is compared to the MAT2 region of N. fischeri. (B) The three dot plots on the left show comparisons of the MAT1 region of E. nidulans with A. fumigatus Af293 MAT-2 (top), N. fischeri MAT1 (middle), and N. fischeri MAT2 (bottom). The three dot plots on the right show a comparison of the MAT2 region of E. nidulans with A. fumigatus Af293 MAT-2 (top), N. fischeri MAT1 (middle), and N. fischeri MAT2 (bottom).

