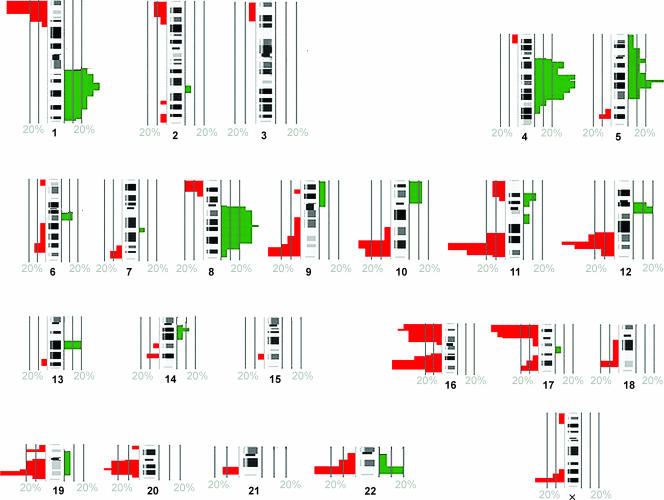
Figure 1.
Frequency graph of aberrations in 15 cases of synchronous breast cancer obtained by mCGH. The green marks on the right side of the chromosome ideograms indicate the frequency of chromosomal gains, and the red marks on the left show the frequency of losses. The cutoff values for chromosomal gain and losses were 1.2 and 08, respectively. The graph was created with the Progenetix software [21].

