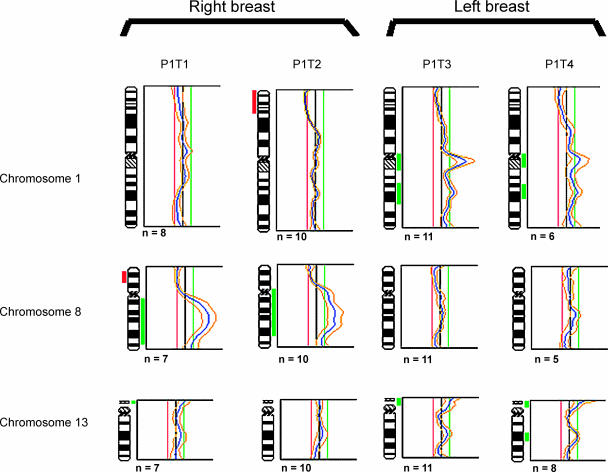
Figure 2.
Comparison of mCGH profiles of synchronous tumors in patient 1 with four synchronous breast tumors. Tumors P1T1 and P1T2 show no gain on 1q, whereas tumors 3 and 4 are similar in showing gains on chromosome 1q. Tumors P1T1 and P1T2 have high gains of 8q, whereas tumors P1T3 and P1T4 show normal profiles for chromosome 8. Chromosome 13 in tumor 4 shows a low-level gain in the q region. Although tumors P1T1, P1T2, and P1T3 have not been (marked to have) scored as having this chromosomal gain, this region in these cases has “spikes” just below the threshold, suggesting a possible gradual increase in chromosomal instability in this region. For each profile, the black vertical line on the middle represents a ratio of 1.0; the red line on the left represents a ratio of 0.8; and the green line on the right represents a ratio of 1.2. Alterations to the right represent chromosomal gains, and alterations to the left are chromosomal losses. Gains and deletions are marked next to chromosome ideograms as green and red bars, respectively.

