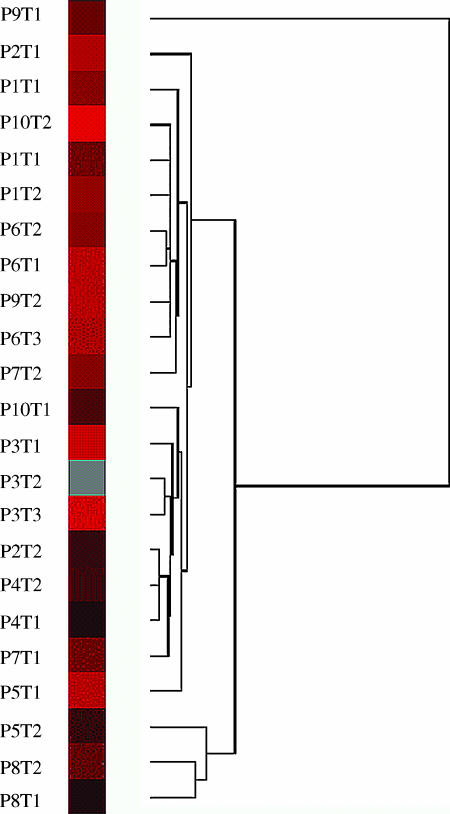
Figure 4.
Cluster analysis of array data showing the relative relationship between synchronous breast cancer tumors. Tumor samples with a high degree of similarity are connected to the tree by very short branches. Tumors with decreased similarity are joined by increasingly longer branches. Tumors in patient 8 (P8T1 and P8T2) and patient 3 (P3T1 and P3T2) show the greatest degree of similarity to their synchronous counterparts. In patient 6, only tumors P6T1 and P6T2 are clustered closely, whereas P6T3 is only distantly related. Tumors P1T3 and P1T4 (left breast) from patient 1 also clustered closely but separated from P1T1 and P1T2 (right breast). Note that not all tumors are matched to their synchronous counterparts. The clustering map was created with Eisen cluster.

