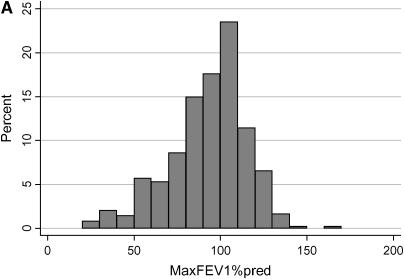
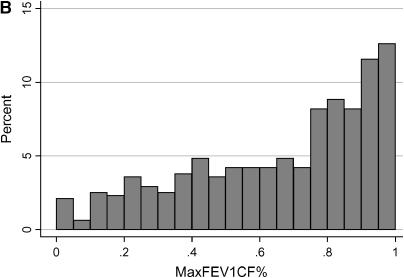
Figure 1.
Distribution of the cross-sectional measures of lung function in the cystic fibrosis (CF) twins and siblings. (A) The x axis represents FEV1 expressed as percent-predicted based on the equations of Knudson (MaxFEV1%pred), in increments of 10%. The y axis shows the percentage of study patients with a MaxFEV1%pred that falls within each 10% increment. (B) FEV1 expressed as CF-specific percentile based on the equations of Kulich (FEV1CF%), in increments of 0.05. The y axis shows the percentage of study patients with an FEV1CF% that falls within each 0.05 increment. FEV1CF% is expressed as a fraction, with 0 corresponding to the most severe lung disease and 1 corresponding to the mildest lung disease (i.e., the equivalent of the 100th percentile).


