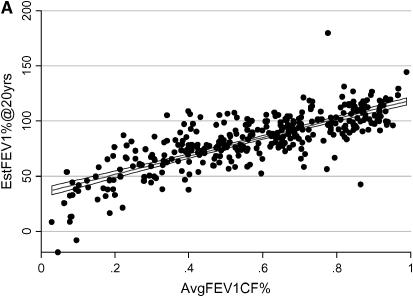
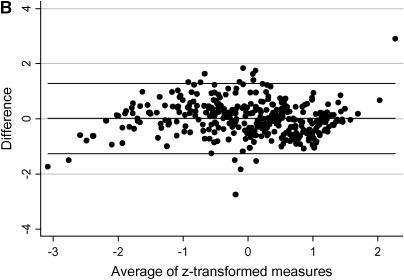
Figure 2.
Agreement between longitudinal measures of lung function. (A) Each point on the graph represents an individual subject with a minimum of 5 years of pulmonary function testing data while living at home with an affected sibling. The x axis represents the average FEV1CF% (AvgFEV1CF%) and the y axis represents the estimated FEV1% at 20 years (EstFEV1%@20yrs) for each individual. The best-fit line with 95% confidence intervals are shown. (B) Each point on this Bland-Altman plot represents a single subject. The x axis represents the mean of the two longitudinal measures and the y axis represents the difference between the two longitudinal measures for each subject. The horizontal lines on the graph represent the mean difference between the two measures for all subjects (center line) and +2 and −2 standard deviations from that mean (upper and lower horizontal lines, respectively).


