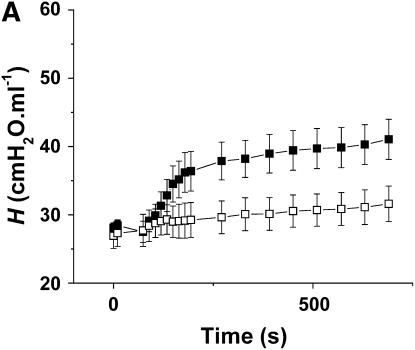
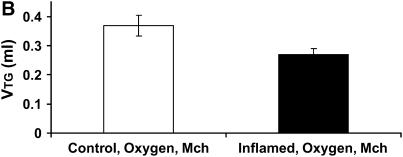
Figure 6.
(A) Mean values of H versus time for the Inflamed-O2 mice (n = 5, solid symbols) and Control-O2 mice (n = 5, open symbols). H was significantly elevated in the Inflamed-O2 mice over the Control-O2 mice (p < 0.001). (B) Vtg was determined post mortem from micro-computed tomography scans. Inflamed-O2 mice challenged with methacholine had significantly lower lung volumes (p < 0.05) than Control-O2 mice. Error bars indicate SEM. All measurements were obtained at a positive end-expiratory pressure of 3 cm H2O.


