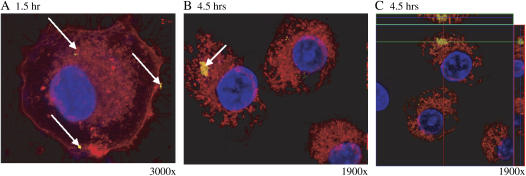
Figure 2.
APMS-TEG enter lung epithelial (C10) cells in a time-dependent manner. CSLM images at 1 h (A) and 4.5 h (B and C) after addition of APMS-TEG (0.75 × 10⁷ APMS/cm2 surface area dish). In C, note the cluster of APMS internally that is integrated with membrane-bound organelles (red). Arrows indicate location of APMS (labeled with Alexa 532, false-colored yellow), and cell nuclei are blue. To enhance the contrast in A, low-intensity yellow pixels (below intensity 30) were colored black.

