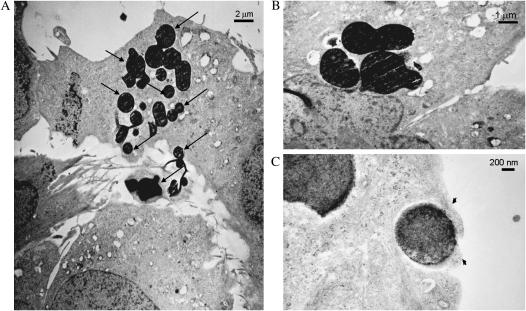
Figure 4.
TEM images show APMS-TEG (arrows) in the cytosol and intercellularly at 1 h after their addition to MM cells. Note the prominent microvilli interacting with intercellular beads in A. B shows perinuclear accumulation of APMS-TEG. Non–membrane-bound beads surrounded by cell surface cytoplasm (arrowheads) are shown in C.

