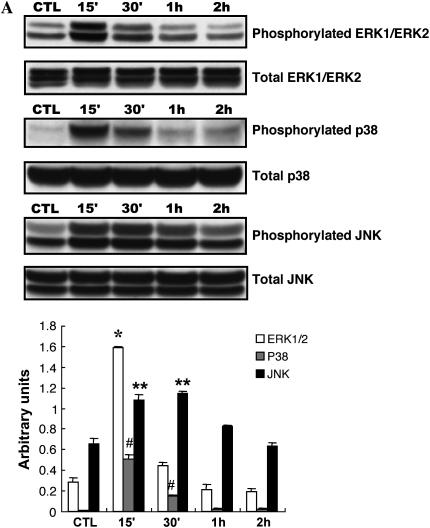
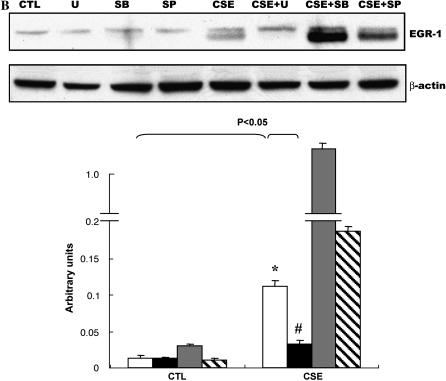
Figure 6.
Effects of CSE on phosphorylation of the MAPKs in NL9 cells. Lysates from NL9 cells incubated in the absence (CTL) or in the presence of CSE (20%) for the indicated times were subjected to Western blot analysis using phospho-specific antibodies (A, top to bottom) to detect ERK1/2, p38 MAPK, or JNK. As controls, the same cell lysates were subjected to Western blot analysis using corresponding non–phospho-specific antibodies to detect total ERK1/2, total p38 MAPK, or total JNK. Quantitation of Western blot immunoblots were performed by densitometric scanning of blots (A, bottom) (*,#,**P < 0.05 versus each CTL). (B) Effects of MAPK inhibitors on CSE-induced EGR-1 protein expression in NL9 cells. NL9 cells were pretreated with or without MEK inhibitor U-0126 (U, 10 μM; solid bars), p38 MAPK inhibitor SB-203580 (SB, 10 μM; shaded bars), or JNK inhibitor SP600125 (SP, 10 μM; hatched bars) as indicated, and then incubated in the absence (CTL) or in the presence of CSE (20%) for 15 min to 1 h (open bars, dimethyl sulfoxide). Cells lysates were subjected to Western blot analysis using anti–EGR-1antibody. The same membrane was probed with an anti–β-actin antibody to assess equal loading of the gel. Quantitation of Western blot immunoblots were performed by densitometric scanning of blots (B, bottom). (C) Effects of MEK inhibitor U-0126 on CSE-induced MT1-MMP and TIMP2. (D) NL9 cells were pretreated with or without MEK inhibitor U-0126 (10 μM) for 1 h, and then incubated in the absence (CTL) or in the presence of CSE (20%) for 2 d. Concentrated media were subjected to gelatin zymography to measure MMP-2 activity. Results of densitometry of active MMP-2 bands are shown in the bar graph at bottom of D.


