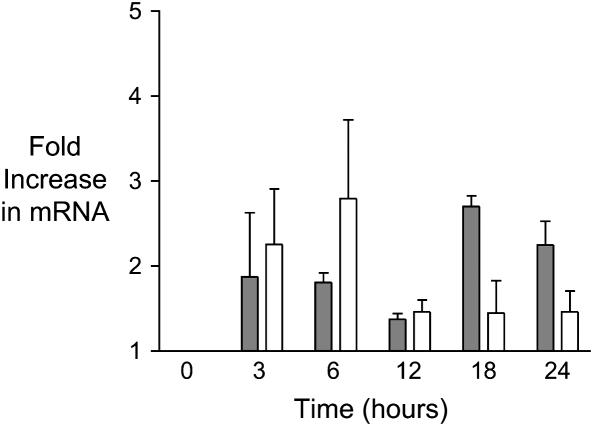
Figure 4.
TM and EPCR mRNA expression in A549 cells in response to cytomix treatment. TM (open bars) and EPCR (shaded bars) mRNA was measured by real-time PCR, and fold-change in mRNA was calculated using the 2ΔΔCt method with normalization to β-actin. Exposure to 20 ng cytomix for increasing lengths of time produced modest but nonsignificant increases in TM and EPCR mRNA. Data are shown as mean ± SD. P = NS by ANOVA with post hoc Tukey's test.

