FIG. 3.
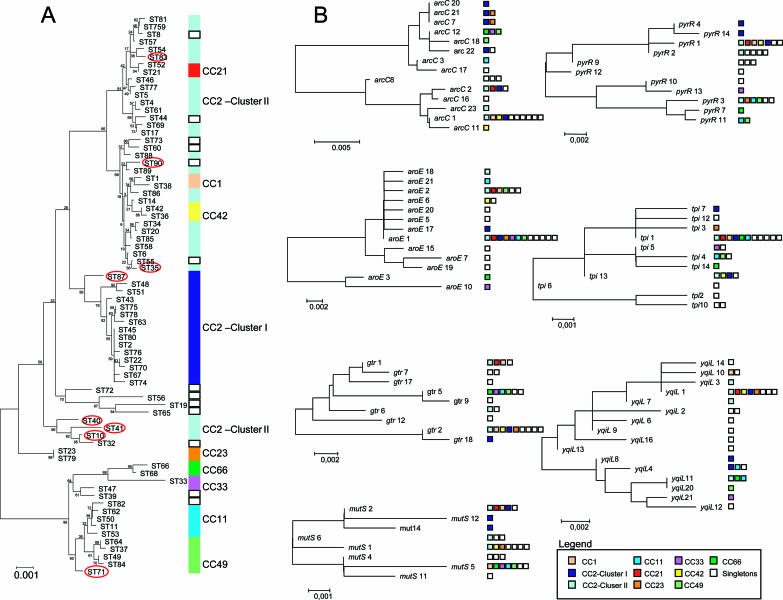
(A) Minimum evolution tree constructed from the concatenated sequences of seven MLST loci for the 74 STs identified in this study. Vertical rectangles correspond to eBURST groups or clonal complexes: each eBURST group or clonal complex is represented by a different color (see legend in the figure). Clonal complex 2 was subdivided into two clusters: cluster I in light blue and cluster II in dark blue. The scale corresponds to evolutionary distance, and bootstrap values are shown for each branch. Red circles correspond to STs that due to recombination events are detached from the clusters defined by eBURST. (B) Neighbor-joining trees constructed from the sequences of all the alleles of each the seven genes included in the MLST. Squares correspond to eBURST groups or clonal complexes. The color scheme for squares is the same as that used in panel A. The scale corresponds to evolutionary distance.

