
FIG. 3.
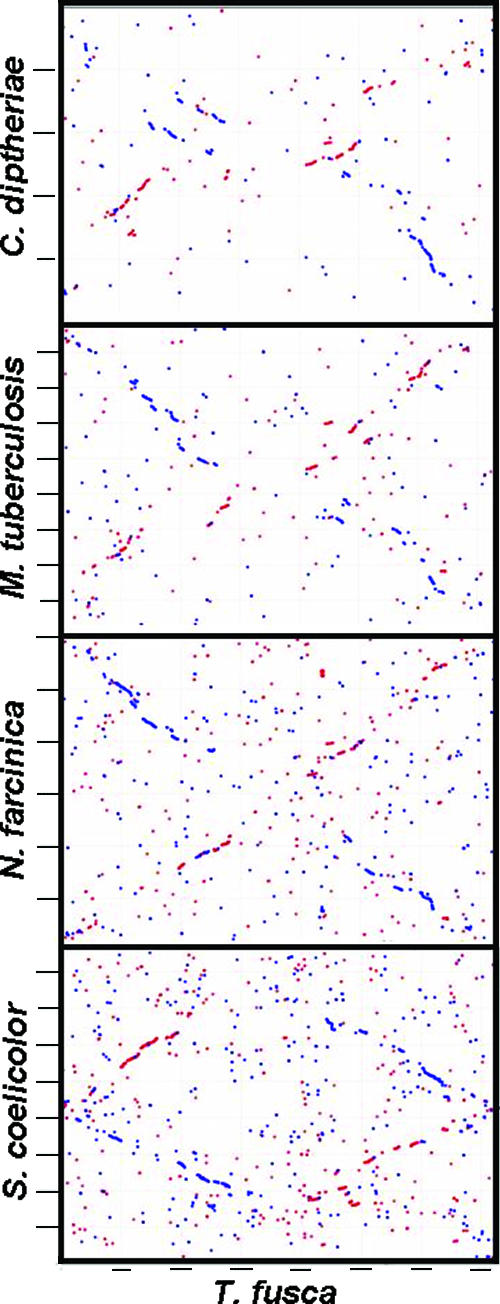
Synteny plots between T. fusca (horizontal axis) and five representative genomes of Actinobacteria: Streptomyces coelicolor, Nocardia farcinica, Mycobacterium tuberculosis, and Corynebacterium diphtheriae.
Official websites use .gov
A
.gov website belongs to an official
government organization in the United States.
Secure .gov websites use HTTPS
A lock (
) or https:// means you've safely
connected to the .gov website. Share sensitive
information only on official, secure websites.
Synteny plots between T. fusca (horizontal axis) and five representative genomes of Actinobacteria: Streptomyces coelicolor, Nocardia farcinica, Mycobacterium tuberculosis, and Corynebacterium diphtheriae.