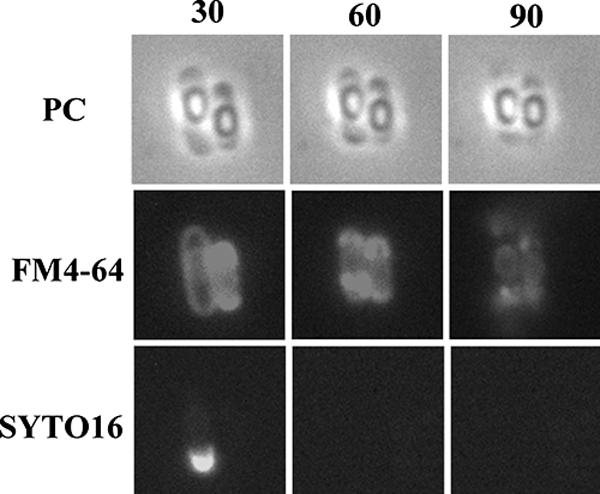
FIG. 4.

Final process of mother cell death. Typical cells in which the mother cell membrane appeared to have burst are shown. Strain 168 was monitored beginning at T13. Time-lapse intervals are indicated in minutes from the first observation time. Phase-contrast (PC) images are shown in the upper row, and corresponding fluorescence images with membrane-staining dye FM4-64 and DNA-staining dye SYTO16 are shown in the middle and lower rows, respectively.
