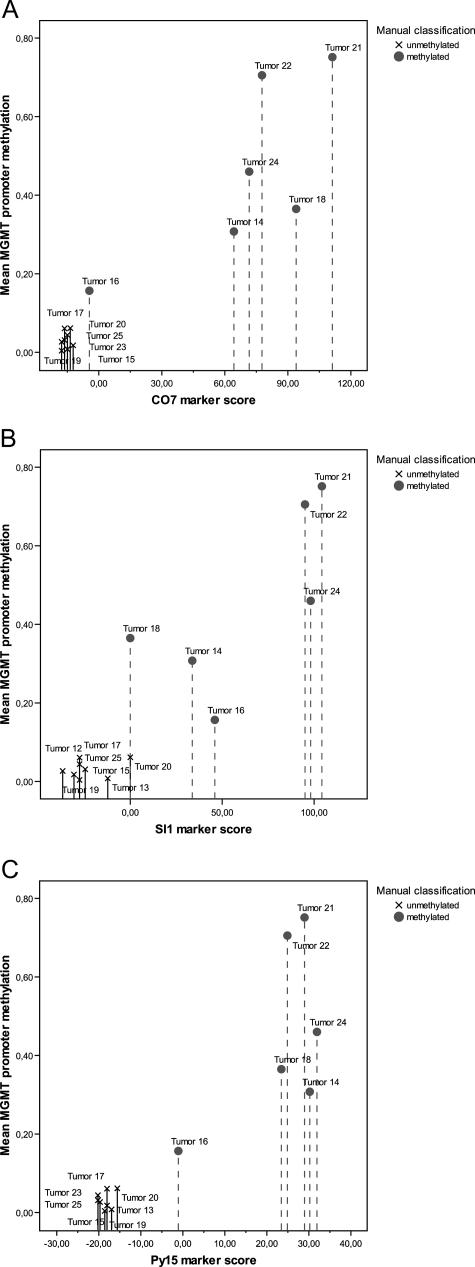
Figure 10.
Marker scores for all three methods plotted against overall methylation level. The CO7 marker (a) is based on the analysis of CpGs 1, 2, 5, 8, and 9. The SI01 marker (b) is based on the analysis of CpG 13, and the Py15 marker (c) is based on the analysis of the CpG positions 9, 10, 11, and 12.

