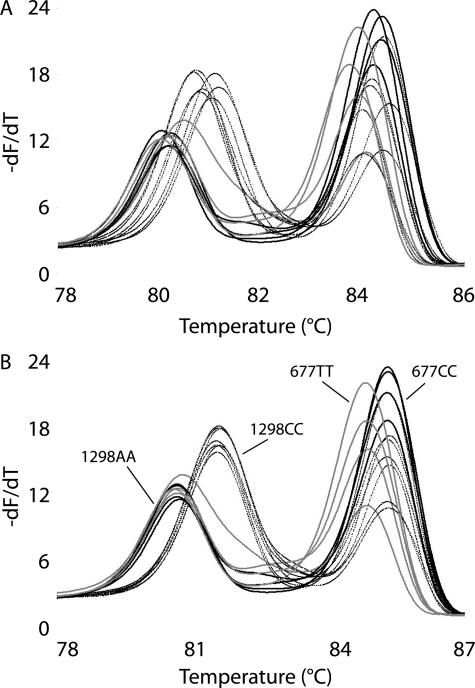
Figure 3.
Duplex MTHFR derivative melting plots for genotyping the 1298A>C and 677C>T variants. Genotypes shown are 1298AA/677CC (thick black line), 1298CC/677CC (thin black line), and 1298AA/677TT (gray line). A: Without temperature correction. B: With temperature correction using high- and low-temperature controls (not shown).

