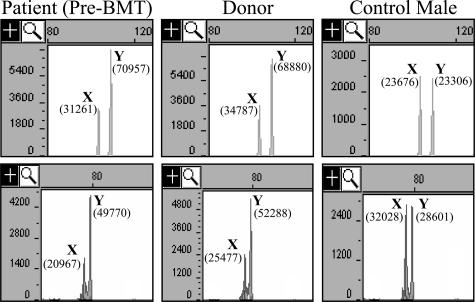
Figure 1.
Capillary electrophoresis analysis of amplification of intron 1 (top) and exon/intron 4 (bottom) of amelogenin. Horizontal axis is size in bases. Vertical axis is fluorescence intensity. Shown are results from the patient before bone marrow transplant (pre-BMT), donor, and a representative normal male. AMELX- and AMELY-specific peaks are identified by X and Y, respectively. The area of each peak is shown in parentheses.

