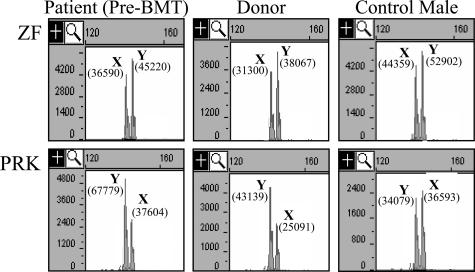
Figure 3.
Capillary electrophoresis analysis of amplified products from genes ZF (top) and PRK (bottom). Horizontal axis is size in bases. Vertical axis is fluorescence intensity. Shown are results from the patient before transplant, the donor, and a representative normal male. The X and Y homologs of each gene are identified by X and Y, respectively. The area of each peak is shown in parentheses.

