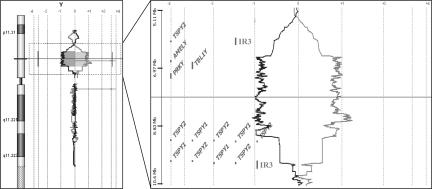
Figure 4.
Oligonucleotide CGH analysis of the Y chromosome of the patient before transplant. The gray line to the right represents the patient/control fluorescence intensity ratios (patient labeled in Cy5, control in Cy3). The dark line to the left represents fluorescent intensities obtained from a second hybridization in which the dyes have been reversed (control/patient). An expanded view of the duplicated region is shown to the right, demonstrating the genes in this region.

