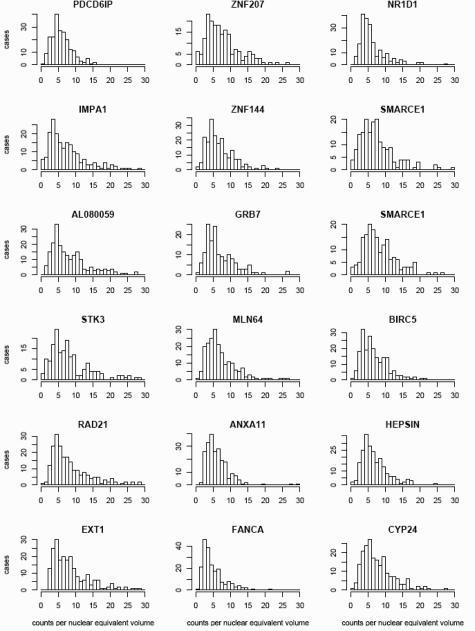
Figure 2.
The individual histograms display the number of cases (y axis) containing the average DNA copy number per nuclear equivalent volume indicated by each bar (x axis) for each probe. Data for all 229 specimens are included. Two histograms are shown for SMARCE1, because hybridization for this probe was performed in duplicate.

