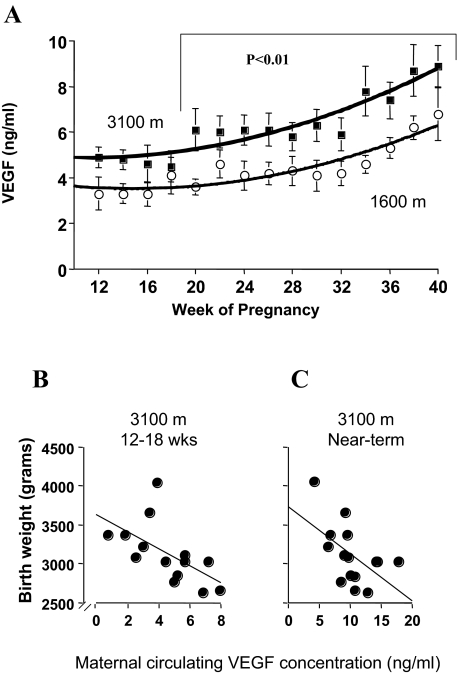
Figure 4.
Circulating VEGF levels and correlations with birth weights at different altitudes. A: Total VEGF concentrations during pregnancy at different altitudes. MA (open circles, hatched line) and HA (closed circles, solid line). The symbols are the mean and SD of the VEGF concentration measured at a particular time point, whereas the lines represent the best-fit regression equations of the time course of change in VEGF (MA, y = 0.004x2 − 0.130x + 4.493, r2 = 0.83; HA, y = 0.005x2 − 0.097x + 5.369, r2 = 0.86). VEGF concentrations were significantly elevated from week 20 onward at high versus moderate altitude. B: Maternal blood VEGF concentrations measured at 14.7 ± 1.3 weeks (range, 12 to 18 weeks) were inversely correlated with birth weight at high altitude (y = 3629.62 − 109.41x, r2 = 0.35, P < 0.05). C: VEGF concentration in the last maternal blood sample obtained before delivery (range, 34 to 39 weeks; mean, 35.7 ± 1.2) was inversely correlated with birth weight at high altitude (y = 3673.28 − 65.15x, r2 = 0.28, P < 0.05).

