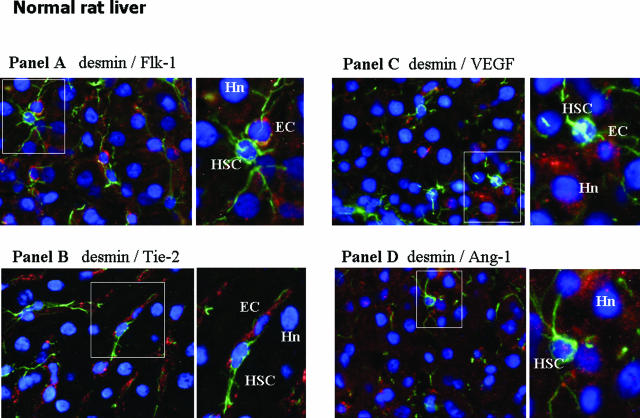
Figure 7.
In vivo localization of HSC, proangiogenic cytokines, and related receptors in normal liver (A–D). Immunofluorescence was performed on liver cryostat sections from the liver of control (ie, untreated) rats at 9 weeks in the CCl4-dependent chronic protocol for fibrosis induction. All panels include the following: 1) a larger image on the left side offering electronic merging of images acquired for single fluorescence (blue fluorescence, DAPI staining; green fluorescence, desmin staining; red fluorescence, growth factor or receptor under analysis: A: Flk-1; B: Tie-2; C: VEGF; D: Ang-1); and 2) a higher digital magnification (right) of the boxed area. Hn, hepatocyte nucleus; EC, endothelial cell. Original magnifications, ×400.

