Figure 1.
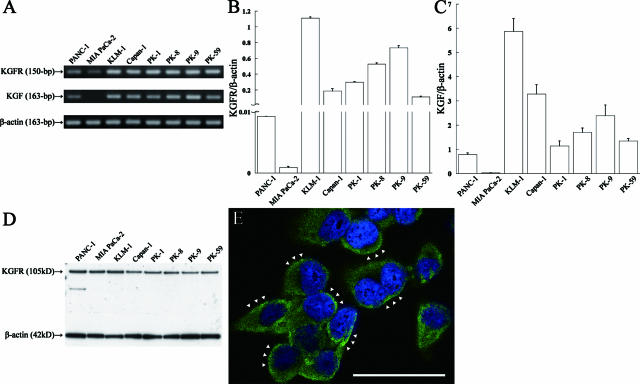
KGFR and KGF in pancreatic cancer cell lines. A: RT-PCR analysis of KGFR and KGF mRNA in pancreatic cancer cell lines. Total RNA was extracted from PANC-1; MIA PaCa-2; KLM-1; Capan-1; and PK-1, -8, -9, and -59 cells and used to perform cDNA synthesis and PCR analysis. KGFR mRNA (150 bp) was detected in all cell lines (top). KGF mRNA (163-bp) was detected in all pancreatic cancer cell lines, except for MIA PaCa-2 cells (middle). β-Actin mRNA (163 bp) served as a loading control (bottom). B and C: Q-PCR analysis of KGFR and KGF mRNA in pancreatic cancer cell lines. KGFR mRNA was expressed at variable levels in all pancreatic cancer cell lines. KGF mRNA was not detected in MIA PaCa-2 cells and was expressed at variable levels in the other pancreatic cancer cell lines. Results are expressed as KGFR/β-actin and KGF/β-actin. Gene expression measurements were performed in triplicate. Bars represent the mean ± SE. D: Western blot analysis of KGFR in pancreatic cancer cell lines. A band corresponding to the 105-kd KGFR protein was detected in all pancreatic cancer cell lines (top). β-Actin served as a loading control (bottom). E: Immunofluorescent analysis of KGFR expression in MIA PaCa-2 cells. KGFR immunoreactivity was detected in the cytoplasm and/or on the membrane of cancer cells. In some cases, a strong KGFR signal was detected at the cell membrane (arrowheads). Bar = 50 μm.

