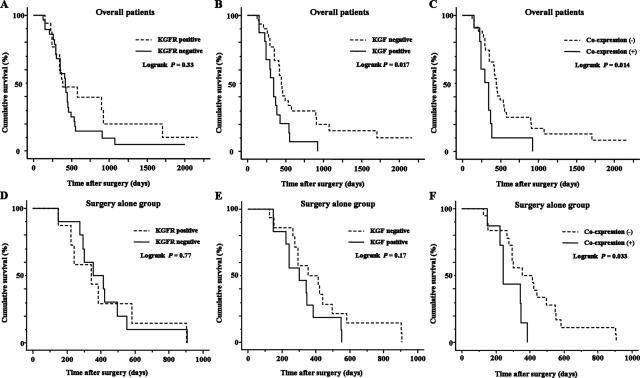
Figure 3.
Cumulative Kaplan-Meier survival curves. A: Curves for all patients with KGFR-positive or -negative tumors. B: Curves for all patients with KGF-positive or -negative tumors (P = 0.017). C: Curves for all patients with the presence or absence of both KGFR and KGF (P = 0.014). D–F: Curves for the subgroup of patients who underwent surgery alone. Statistical significance was only observed in the patients whose tumors were positive for both KGFR and KGF (P = 0.033; F).

