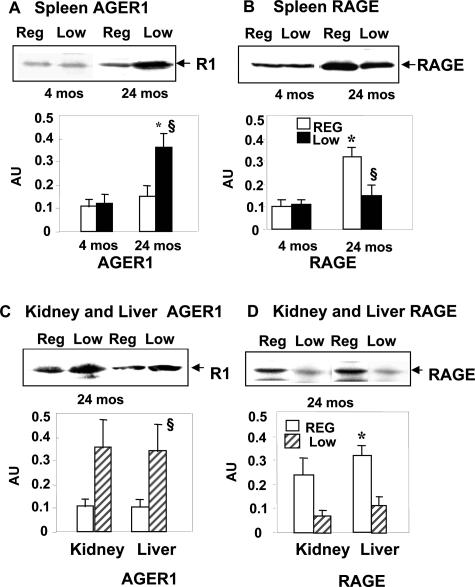
Figure 6.
Levels of AGER1 and RAGE. AGER1 (A) and RAGE (B) protein levels were assessed in spleen tissues from RegAGE and LowAGE mice (n = 6/group) at 4 and 24 months. AGER1 expression (C) in kidney and liver and RAGE expression (D) in kidney and liver of the same mouse groups were also assessed at 24 months by Western blotting and densitometric analysis. Data are shown as M ± SEM of three independent experiments (*P < 0.01 versus 4-month RegAGE; §P < 0.01 versus 24-month RegAGE).

