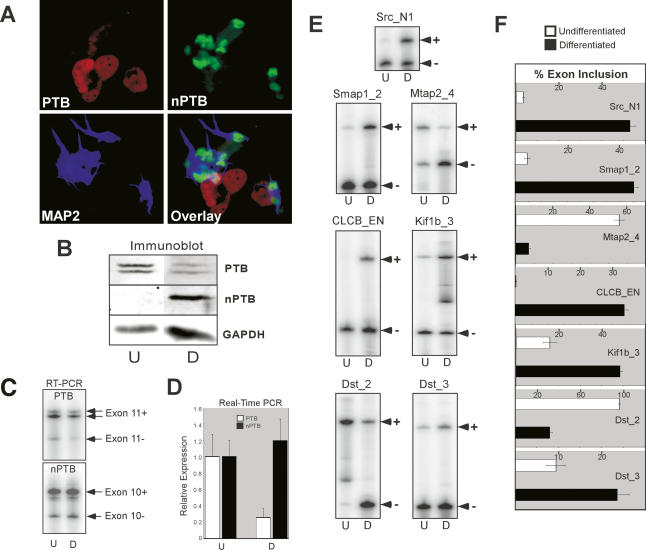
Figure 2.
Developing neurons switch from PTB to nPTB expression concomitant with changes in alternative splicing. (A) Immunofluorescence of differentiated P19 cells 13 d after RA treatment. The field of cells is stained for PTB (red), nPTB (green), and the neuronal marker MAP2 (blue). An overlay of the three colors is shown in the bottom right panel. (B) Protein lysates from undifferentiated (U) and 13-d differentiated (D) P19 cells were immunoblotted for PTB and nPTB, with GAPDH as a loading control. Note that PTB appears as a doublet due to the presence of alternative splicing of exon 9. (C) Semiquantitative RT–PCR of PTB and nPTB alternative splice variants. PTB exon 11-included (Exon 11+) and exon 11-skipped (Exon 11−) and nPTB exon 10-included (Exon 10+) and exon 10-skipped (Exon 10−) splice variants are indicated. Note an additional band in the PTB Exon 11+ lane is due to a second alternative splice at a different location. (D) Real-time PCR quantification of PTB and nPTB mRNA measured relative to β-actin mRNA. (E) Alternative splicing of PTB/nPTB-regulated exons assayed by RT–PCR. The exon IDs and the RT–PCR products corresponding to exon-included (+) and exon-skipped (−) forms are indicated. (F) Quantification of exon inclusion in E. The percent exon inclusion is graphed for differentiated (black bars) and undifferentiated (white bars) cells. The error bars in D and F indicate the standard error among three separate experiments.

