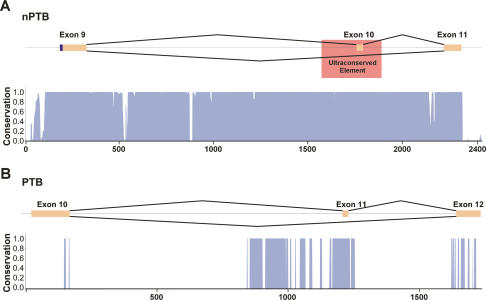
Figure 4.
nPTB exon 10 is within an ultraconserved region. (A) Schematic showing the genomic region of nPTB exons 9–11, with exons shown in orange, and introns shown as black lines. The location of the previously defined ultraconserved element is indicated by a red box. A histogram displaying the degree of conservation of this region among 17 vertebrate species is shown below in blue, as determined by the UCSC genome browser (http://genome.ucsc.edu). A score of 1 indicates 100% identity among all species at that nucleotide position. A distance scale in nucleotides is shown below the histograms. (B) The homologous region of PTB, exons 10–12, is shown with the same annotation as in A.

