Figure 6.
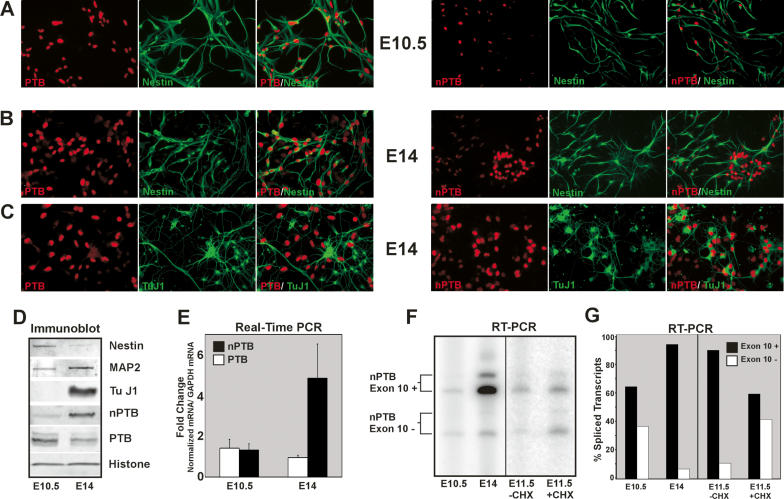
nPTB replaces PTB as NPCs mature into neurons. (A–C) Immunofluorescence of E10.5 (A) and E14 (B,C) NPCs in culture. Individual staining for PTB (left panels, red) or nPTB (right panels, red), Nestin (A,B, green), or TuJ1 (C, green) are shown along with overlays of the two-color staining for each field. Signal gain for the nPTB staining in the right panel of A has been increased to show the fainter nPTB signal. (D) Immunoblot of lysates prepared from E10.5 and E14 cultures, probed for the NCP marker Nestin, the neuronal markers MAP2 and TuJ1, nPTB, PTB, and Histone H3 as a loading control. (E) Real-time PCR of cDNAs prepared from E10.5 and E14 cell lysates. PTB (white bars) and nPTB (black bars) mRNA levels were quantified relative to GAPDH mRNA, and the fold change in each mRNA from E10.5 to E14 is graphed. (F) RT–PCR of the nPTB alternatively spliced region. Exon 10-included (Exon 10+) and exon 10-skipped (Exon 10−) splice variants are indicated for E10.5 and E14 cells, and E11.5 cells incubated for 6 h without (−CHX) or with (+CHX) cycloheximide prior to harvesting. (G) Quantification of splice variants shown in F. The percentage of total spliced transcripts in which exon 10 is included (+, black bars) or skipped (−, white bars) is graphed.

