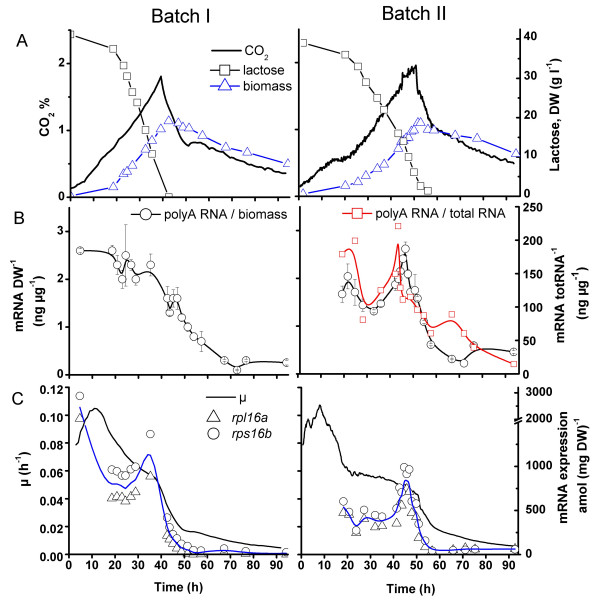
Figure 1.

PolyA RNA and ribosomal protein mRNA levels in twobatch cultures of T. reesei. A. Lactose, biomass and CO2 concentrations in batch cultures I and II. B. PolyA RNA concentration relative to biomass in cultures I and II and polyA RNA concentration relative to total RNA in culture II. C. Specific growth rate (μ) and expression of two ribosomal protein mRNAs (rpl16a, rps16b) relative to biomass. Cultures were maintained at 28°C and pH 5.5 – 6.
