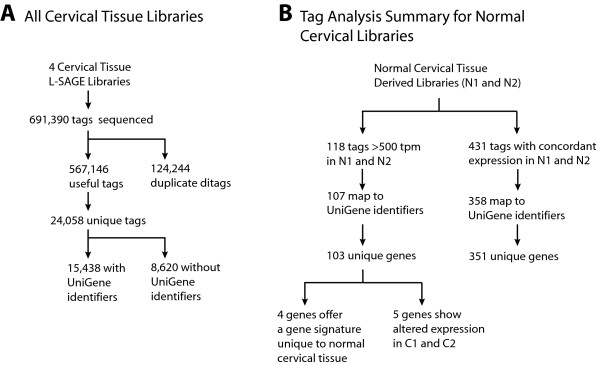
Figure 1.

Flow diagram of SAGE analysis and tag-to-gene mapping. A. Sequence tags yielded from the four SAGE libraries were catagorized. Useful tags indicate all sequenced tags less duplicate ditags. B. The abundance and classification of unique tags in the SAGE libraries of normal cervix tissue (N1, N2) are summarized.
