
Figure 4.
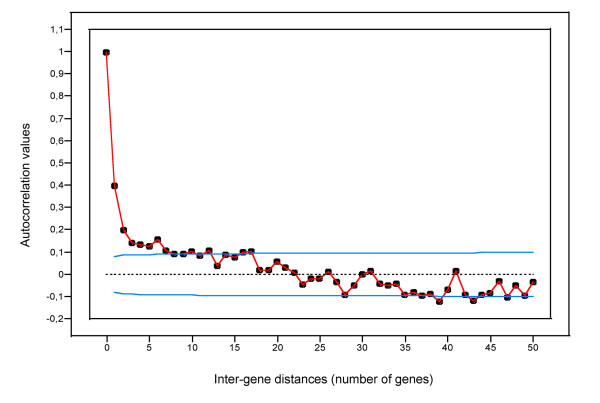
Autocorrelation function of the spatial series corresponding to the Buchnera log2 nBGT along the chromosome. The blue lines represent ± 2 standard errors for approximate 95% confidence limits (i.e., values above the threshold are significant).