
Figure 4.
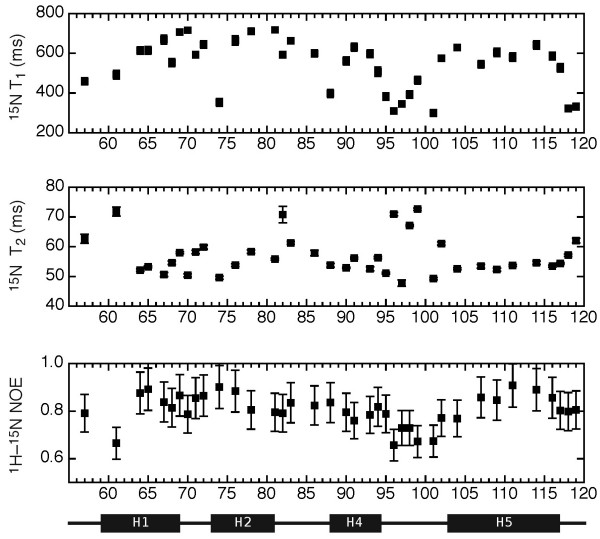
A NMR relaxation study of the DLC2-SAM domain. (a) Per residue 15N T1 longitudinal relaxation times. (b) Per residue 15N T2 transverse relaxation times. (c) Per residue heteronuclear NOE ratios.
Official websites use .gov
A
.gov website belongs to an official
government organization in the United States.
Secure .gov websites use HTTPS
A lock (
) or https:// means you've safely
connected to the .gov website. Share sensitive
information only on official, secure websites.
A NMR relaxation study of the DLC2-SAM domain. (a) Per residue 15N T1 longitudinal relaxation times. (b) Per residue 15N T2 transverse relaxation times. (c) Per residue heteronuclear NOE ratios.