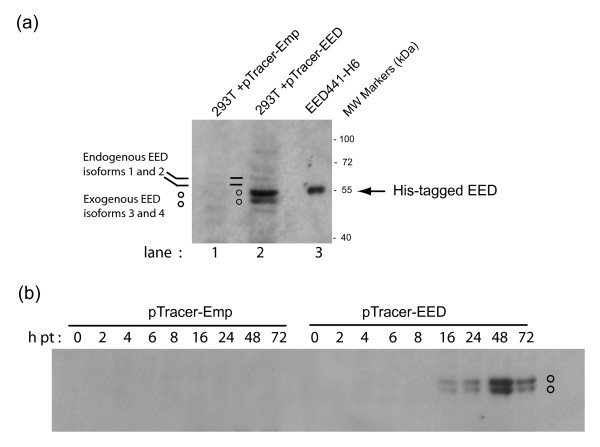
Figure 1.
Over-expression of EED3/4 isoforms in 293T cells. (a), SDS-PAGE and radioimmunoblot analysis of soluble fraction of 293T cell lysates after transfection with pTracer-Emp (lane 1) or pTracer-EED (lane 2) ; bacterially-expressed, histidine-tagged isoform 3 (EED441-H6; arrow) is shown in lane 3. (b), Kinetics of transient expression of exogenous EED3/4, using pTracer-EED versus control empty plasmid pTracer-Emp. Autoradiograms of blots reacted with anti-EED antibody and 35SLR-labeled anti-rabbit IgG antibody. Note that the endogenous EED proteins were barely detectable in soluble lysates from 293T cells, whereas exogenous EEDs were visible as a doublet band at 52 and 51 kDa, detectable as early as 16 h after transfection with a maximum at 48 h.

