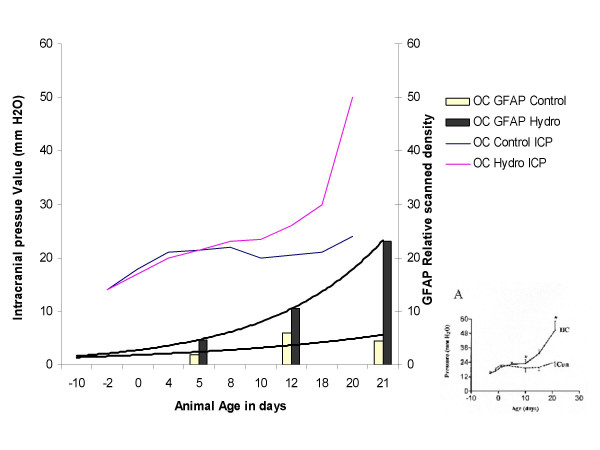
Figure 9.
Correlation between intracranial pressure and astrogliosis. Representation of intracranial pressure data from H-Tx rats by Jones et al. [52] plotted with GFAP levels in the occipital cortex from this study, over time. Original graph of ICP from [52] is in the lower right corner. In the overlay graph, the similarity is shown between the large increase in GFAP levels occurring in the occipital cortex of the 21d hydrocephalic animals and the increase in ICP in similar animals. The fit of the GFAP regression line in the hydrocephalic animals was 0.9997 and the control animals 0.5128. This correlation between the hydrocephalic GFAP levels and the increase in ICP may imply a causative effect on increasing gliosis.

