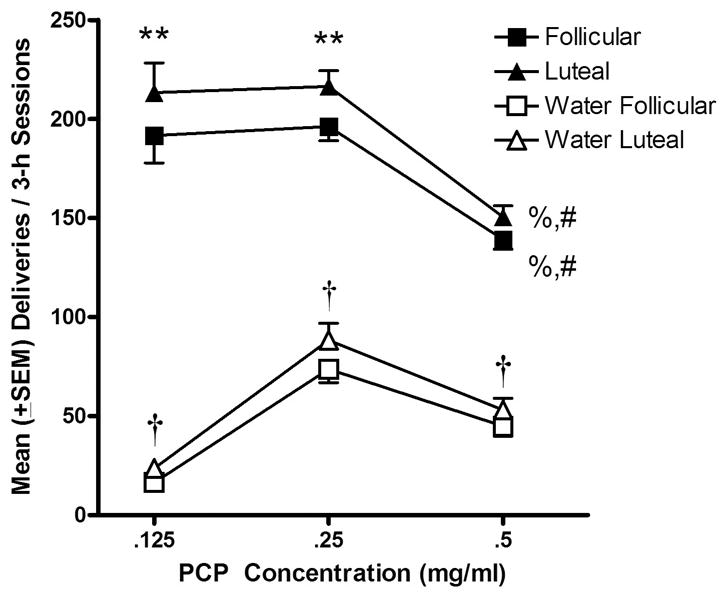
Fig 1.

Mean (± SEM) numbers of PCP (filled symbols) and water (empty symbols) deliveries obtained during follicular phase (days 3–10 following onset of menses; squares) and luteal phase (final 8 days of each cycle; triangles) as a function of PCP concentration. ** P < .01 compared to deliveries obtained during the follicular phase. % P < .01 compared to 0.125 mg/ml within each phase; # P < .01 compared to 0.25 mg/ml within each phase; †P < .01 compared to PCP during both phases.
