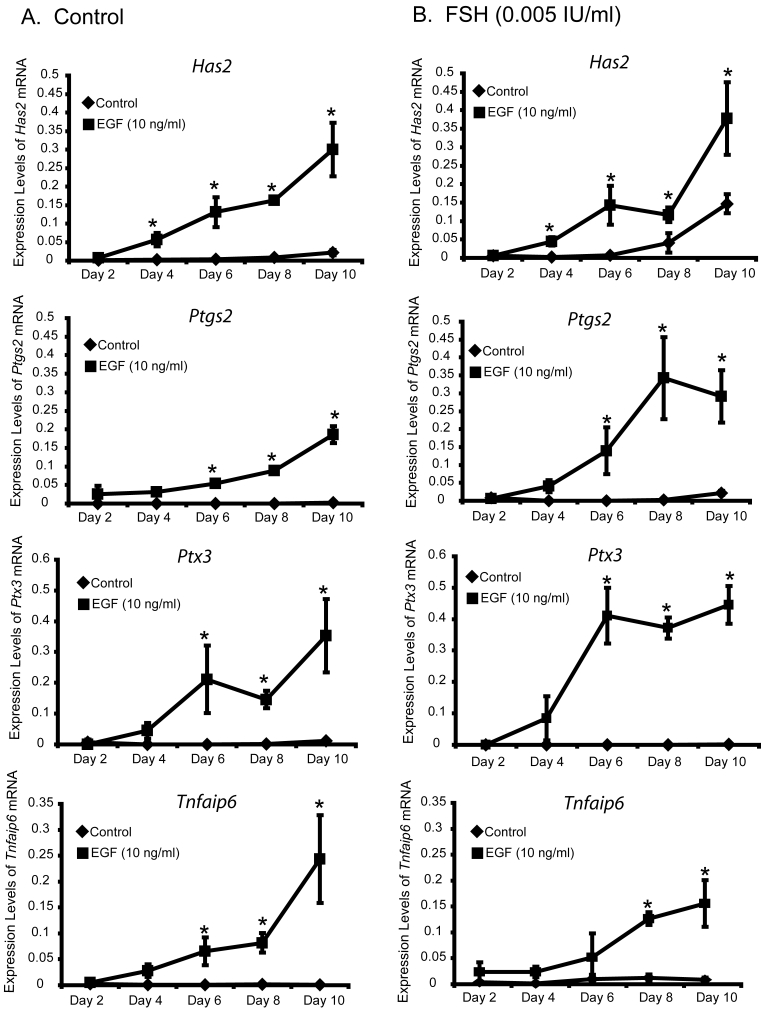
Figure 3.
Expression of Has2, Ptgs2, Ptx3 and Tnfaip6 mRNAs in complexes cultured with (A) control medium, or (B) FSH (0.005 IU/ml) for 2, 4, 6, 8 and 10 days followed by treatment with control medium or EGF (10 ng/ml) for 12 hours during the test period. *Denotes value different from control as determined by Student's t-test, P<0.05.

