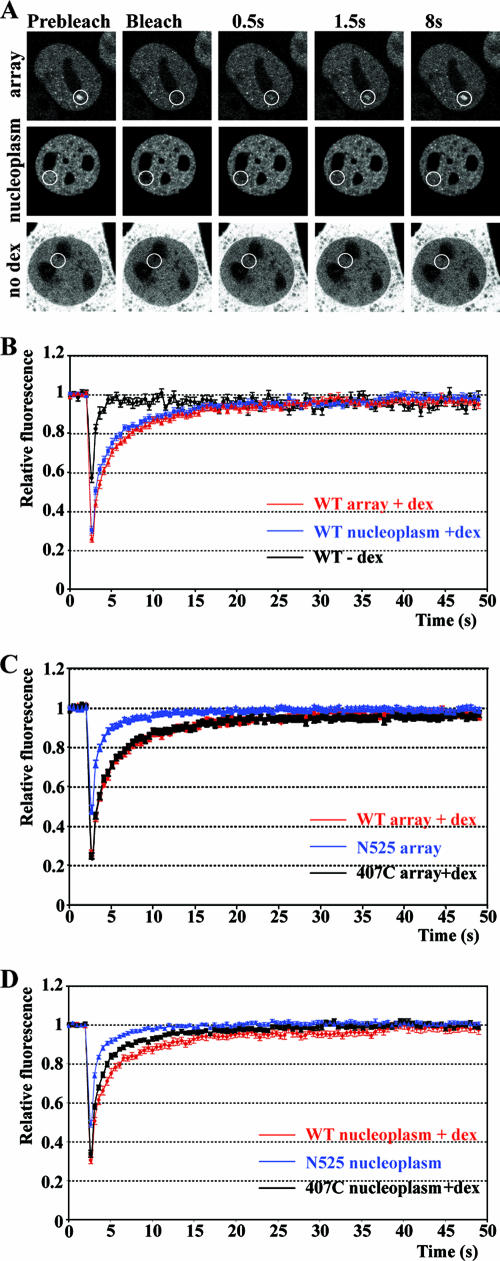
FIG. 3.
Increased GR mobility in the absence of the ligand binding domain. (A) FRAP analysis of GFP-GR in live cells. Single z section images were collected before photobleaching and during recovery at indicated times. Cells were treated with 100 nM Dex for 45 min (array and nucleoplasm) or left untreated (no Dex and nucleoplasmic bleach). White circles indicate bleached areas. (B) Quantitative FRAP analysis of GFP-GR at the array and in the nucleoplasm in cells treated with 100 nM Dex for 30 to 60 min or left untreated (−Dex). Quantitative FRAP analysis at the array (C) or elsewhere in the nucleus (D) for GFP-GR (100 nM Dex), GFP-N525, and GFP-407C (100 nM Dex). All FRAP recovery kinetic data represent averages ± SEM from at least 10 cells imaged in two independent experiments. WT, wild type.

