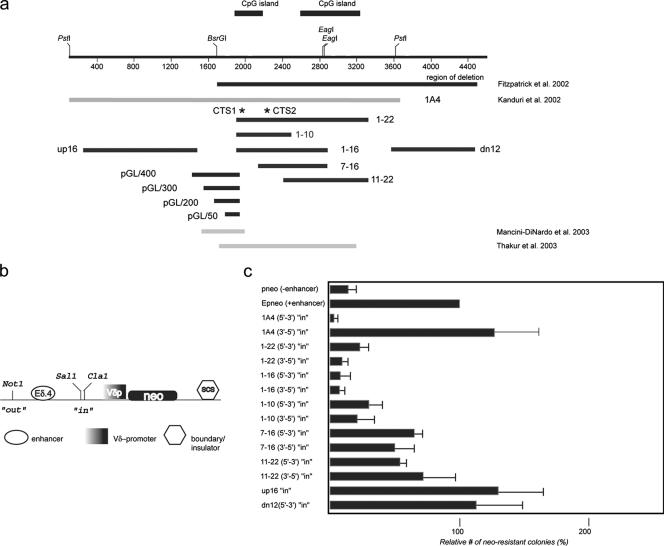
FIG. 3.
Mapping of KvDMR1 repressive activity in an enhancer-blocking assay. (a) The extent of DNA fragments tested for different functional activities are shown as black lines with the name of each fragment indicated. For comparison, the genomic region deleted in mice described in Fitzpatrick et al. (11) is shown as a black bar. The light gray bars are regions of the locus tested for insulator/silencer activity by others (27, 43). (b) Schematic representation of the E-p-neo basic vector used for generation of the experimental constructs (see text for details; SCS is a Drosophila insulator element [SO]). (c) The test-fragments indicated in panel a were inserted in the SalI/ClaI (“in” position) site in the indicated orientations with respect to the endogenous locus, stably transfected into Jurkat cells, and plated on soft agar; neo-resistant colonies were counted after 3 to 4 weeks. Enhancer-blocking activity was assessed as the number of the neo-resistant colonies for a given construct relative to the number of colonies formed with the E-p-neo construct (taken as 100%). Each transfection was done in triplicate. Individual constructs were transfected in two to three independent experiments.

