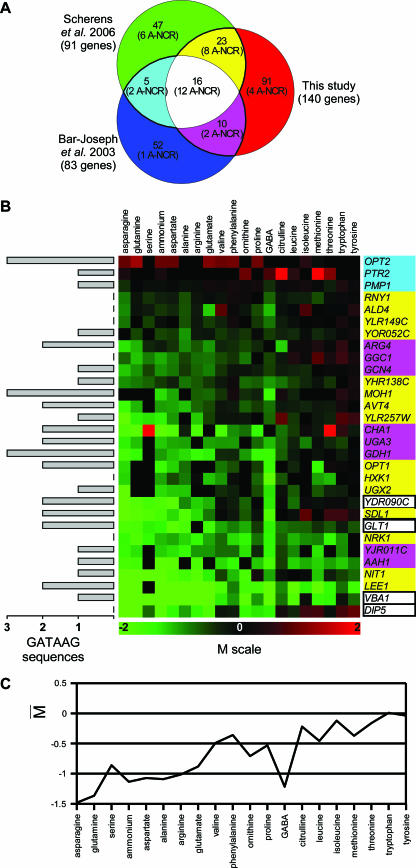
FIG. 4.
Identification of additional P-NCR target genes. (A) Venn diagram showing the numbers of NCR target genes found in common in our study (140 genes [see the text]) and/or in two other genome-wide studies (7, 112). Thick black lines delimit the groups of genes belonging to at least two lists. The number of A-NCR genes included in each section of the diagram is also indicated. (B) Expression profiles of 30 highly P-NCR target genes (see the text). The P-NCR genes shown here are those belonging to at least two of the gene lists presented in panel A and which are not A-NCR genes. The color code of the genes is the same as that used in the Venn diagram presented in panel A. The M values and the numbers of GATAAG sequences are indicated as for Fig. 2A and 3A, respectively. (C) Influence of the nitrogen source on the expression levels (average of M values as described in the legend of Fig. 2B) of the 30 P-NCR genes shown in panel B. The nitrogen sources are sorted according to the classification presented in Fig. 2A.

