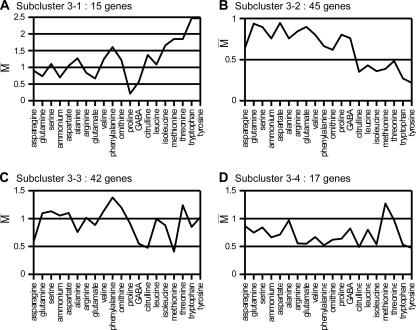
FIG. 7.
Many yeast genes are more highly expressed on most tested nitrogen sources than on urea. Influence of the nitrogen source on the expression levels (averages of M values, as described for Fig. 2B) of four subclusters of coregulated genes (see the text). The nitrogen sources are sorted according to the result of the classification presented in Fig. 2A.

