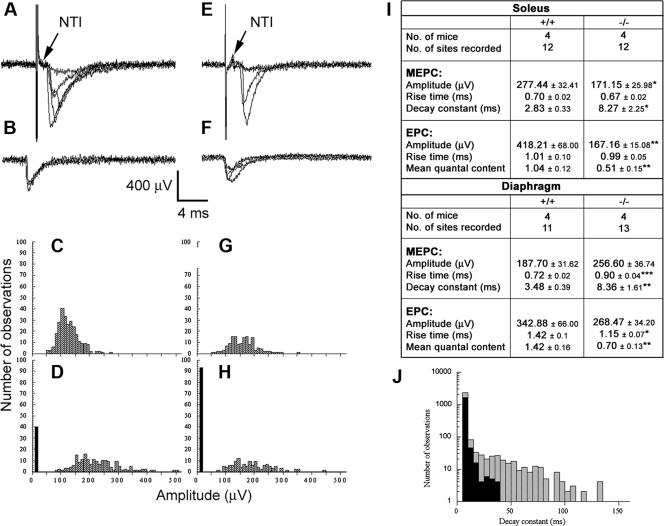
FIG. 5.
Extracellular recordings from NMJs of homozygous floxed control (A to D) and Gabpα conditional knockout mice (E to H). Panels A and E show examples of evoked EPCs. Panels B and F show examples of MEPCs. In panels A, B, E, and F, five consecutive traces are superimposed. Note the invariable presence of the NTI in both control (A) and mutant (E) recordings. Frequency amplitude histograms of MEPCs (C and G) and evoked (D and H) amplitudes are shown. The histograms shown in panels C and D were constructed from a single recording site, as were the histograms shown in panels G and H. The distributions of MEPC amplitudes were similar in both control and Gabpα conditional-knockout mice. EPCs were skewed toward higher amplitudes in control mice, and the number of failures (black bars) was higher at NMJs from Gabpα mutant mice (H) compared to controls (D). (I) Comparison of biophysical properties of 3-month-old homozygous floxed Gabpα control (+/+) and Gabpα conditional-knockout (−/−) mice. *, P < 0.05; **, P < 0.01; ***, P < 0.001 (Student's two-tailed t tests). (J) Representation of MEPC decay rate constants from NMJs of Gabpα conditional-knockout (hatched bars) and homozygous floxed (black bars) mice. The histograms were constructed from a single recording site taken from either mutant or control soleus muscle. The decay rate constants for control MEPCs varied from 10 ms to 35 ms. In contrast, the decay rate for Gabpα mutant mice varied from 10 ms to 130 ms. This resulted in a significantly longer mean in decay rates at NMJs of Gabpα conditional-knockout mice than in control animals.

