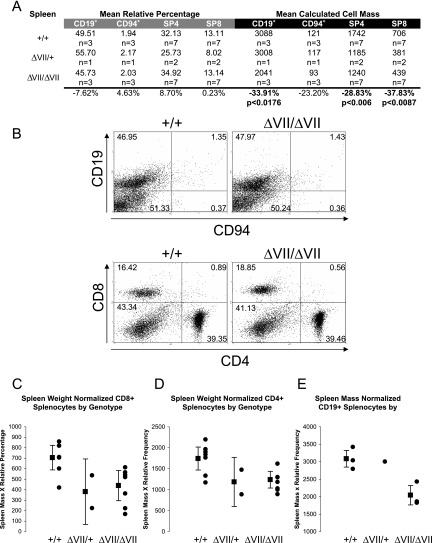
FIG. 4.
Microsplenia in Ets1ΔVII mice results principally from reduced lymphocyte numbers. (A) Table summarizing results of two-color flow cytometry of lymphoid cells of the spleen by CD4/CD8 or CD19/CD94 labeling of splenocytes from 8- to 16-week-old Ets1ΔVII-targeted mice and wild-type littermates. The left half (gray bar) shows average relative percentages of each population, based upon 104 cell counts/mouse. The right half (black bar) shows mean calculated cell mass for each population, as described for Fig. 3B. Relative increase or decrease of mean Ets1ΔVII values compared to wild-type values are indicated at the bottom of the chart. (B) Representative flow cytometry of either CD4/CD8 or CD19/CD94 double-labeled splenocytes from Ets1ΔVII and wild-type mice. Relative percentages are indicated in each quadrant. (C to E) Summary data showing absolute decreases in CD8+, CD4+, and CD19+ splenocytes, respectively, in Ets1ΔVII mice. Black circles indicate individuals; the black square indicates the mean value for the group, with 95% confidence intervals indicated by error bars. Mutant versus wild type (P < 0.01).

