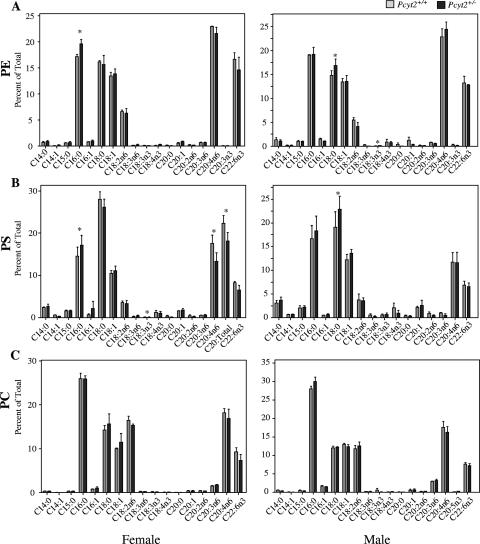
FIG. 10.
Comparison of hepatic phospholipid compositions. Analyses of individual fatty acid side chains of phospholipids for Pcyt2+/+ and Pcyt2+/− livers expressed as a percentage of total. Results are for three mice of each gender and genotype. Data for female and male analyses for PE, PS, and PC are shown. *, P < 0.05.

