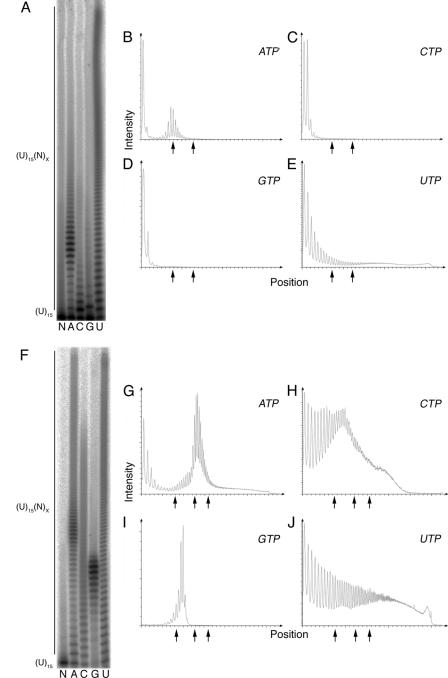
FIG. 5.
Cid1 activity and processivity vary with the nature of the RNA primer. (A) Cid1 complexes were incubated with 5′-labeled (U)15 and either 0.5 mM ATP, 0.5 mM CTP, 0.5 mM GTP, or 0.5 mM UTP (A, C, G, or U, respectively). As a negative control, (U)15 was incubated without Cid1 (lane N). (B to E) Densitometry plots of the ATP, CTP, GTP, and UTP lanes in panel A. Arrows mark positions of 10-, 20-, and 30-nucleotide extensions. (F) tCid1 was incubated with 5′-labeled (U)15 and either 0.5 mM ATP, 0.5 mM CTP, 0.5 mM GTP, or 0.5 mM UTP (A, C, G, or U, respectively). As before, (U)15 was incubated without protein (lane N). (G to J) Densitometry plots of the ATP, CTP, GTP, and UTP lanes in panel F.

